All model development, evaluation, and explanations use synthetic construction payment-protection workflow data. The system supports operational prioritisation and human review — it does not provide legal advice or make automated legal decisions.
Project film · 2 min
From data to human decision, in one walkthrough.
Business problem, temporal validation, model selection, explainability, AWS serving, monitoring, and the human-review boundary. Music only, with no narration; all work-order examples are synthetic.
Project overview
A production-oriented machine-learning system for construction payment-protection workflows. It scores which cases are most likely to run into delay or escalation, so limited review capacity is spent where it matters first. The score is a queue position for a human reviewer, not a decision.
The hard part was never fitting a model — it was building one governed path from raw data to a served score, and being explicit about where the model stops and a person takes over.
Key capabilities
Risk prioritisationScores payment-protection workflows so review effort lands where delay is most likely.
Human-reviewed by designProduces a queue position for a reviewer, never an automated legal decision.
Explainable outputSHAP attributions accompany each score so a reviewer can see what drove it.
Governed data pathOne route from raw storage to served score, with IAM as the boundary around it.
Benchmarked, not assumedSeven model families compared before a champion was frozen.
Monitored in serviceCloudWatch tracks the deployed endpoint rather than assuming stability.
System architecture
One governed path from raw data to a served score.
Scroll through, jump to a chapter directly, or step through with the arrow keys. Every number here is a verified result — nothing in this section is a legal decision.
Chapter 1 / The problem
Payment risk can drift quietly, until something is watching the queue.
Construction payment-protection milestones can slide from on-track toward escalation-worthy without anyone noticing in time. This system watches the queue so a human can review the ones that need it — it does not decide anything on its own.
Illustrative synthetic scenario — for demonstration only, not real project data
Milestone AOn track
Milestone BApproaching deadline
Milestone COperational review priority
Once a milestone crosses the threshold, it is flagged for operational review priority — a queue position, not a legal outcome.
Chapter 2 / The pipeline
One governed path from raw data to a served score.
Every score reaching the dashboard passes through the same AWS pipeline. IAM is drawn here as a security boundary around that pipeline, not as a step in it — it governs who and what can reach each stage.
IAM + Secrets Manager — security boundary, least-privilege access, encrypted at rest and in transit
Currently highlighting S3 — synthetic work order and payment records land here first.
CloudWatch
Logs, metrics, alarms, and feature-drift detection watch every stage continuously.
Glue + Athena
A separate analytics path catalogs and queries the same data for operational reporting.
Model governance
Every prediction is stamped with model version, dataset version, and a trace ID for audit.
CI/CD + pytest
Unit, integration, API, and model tests gate every build before GitHub Actions deploys it.
Chapter 3 / The decision
A frozen threshold routes attention — it does not rule on anything.
Scores at or above 0.20 route to human review; the rest are monitored. This is an operational review priority, not a legal decision, and it never makes one automatically.
Illustrative synthetic scenario — for demonstration only, not real project data
0.20 threshold
0.09 · Monitor
Production champion
Logistic Regression v1
0.20 frozen operational threshold
01Integrated with the governed AWS feature, serving, and monitoring contracts.
02Directly interpretable for a human-reviewed payment-protection workflow.
03No partition-aligned evidence yet demonstrates a material replacement benefit.
04DataRobot remains a benchmark; none of its models is deployed.
Chapter 4 / The benchmark
Seven approaches were benchmarked. The simpler model still runs in production.
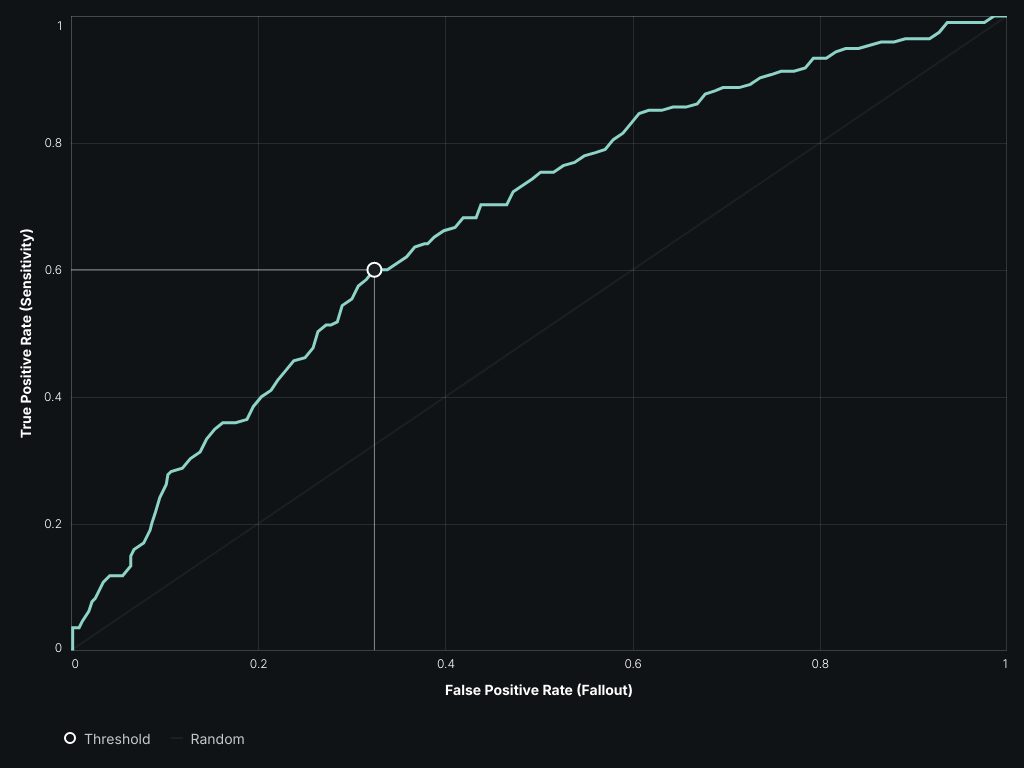
DataRobot AutoML ranked seven models on holdout data. Logistic Regression v1 remains the deployed, governed champion — the benchmark is evidence, not a replacement.
DataRobot holdout ROC-AUC · higher is better · scale begins at 0.65
01Elastic-Net α=0.50.6840
02LightGBM0.6806
03XGBoost0.6765
04GAM0.6748
05Random Forest0.6714
06Elastic-Net L20.6702
07RuleFit0.6625
Backtest ROC-AUC0.6733Elastic-Net α=0.5
Holdout ROC-AUC0.6840Elastic-Net α=0.5
Holdout PR-AUC0.4136Elastic-Net α=0.5
Holdout LogLoss0.5274Elastic-Net α=0.5
These DataRobot partitions differ from the manually engineered AWS experiment, so the figures are not placed on a shared production leaderboard.
Chapter 5 / The explanation
Four factors move the score — direction only, nothing invented.
Feature effects show which direction each factor pushes the modeled risk. No unverified magnitude or ranking is claimed, and none of this is a causal or legal conclusion.
Risk increases
Prior escalation rate
Critical missing fields
Conflicting project information
Risk decreases
Payment-chain completeness
Direction only — no unverified SHAP magnitude or feature rank is presented. Statistical associations, not causal or legal conclusions.
03 / AutoML benchmark & model governance
Evidence before replacement.
Explore the verified DataRobot results and the reasoning behind retaining the production champion. This is a read-only evidence view, not a live scoring or training interface.
DataRobot holdout ROC-AUC
Higher is better · scale begins at 0.65
01Elastic-Net α=0.50.6840
02LightGBM0.6806
03XGBoost0.6765
04GAM0.6748
05Random Forest0.6714
06Elastic-Net L20.6702
07RuleFit0.6625
The truncated scale makes small differences visible; exact values remain the primary evidence.
All development, evaluation, and explanations use synthetic workflow data; no proprietary company or customer data is represented.
DataRobot used different temporal partitions from the manually engineered Logistic Regression experiment. Its results are a benchmark, not an identical head-to-head comparison.
The DataRobot feature-effect and SHAP findings are directional only. No unverified magnitude, ranking, or local explanation is claimed.
Logistic Regression v1 remains the production champion at the frozen 0.20 threshold. The DataRobot benchmark is not deployed.